-
"Sheetsee.js is a JavaScript library, or box of goodies, if you will, that makes it easy to use a Google Spreadsheet as the database feeding the tables, charts and maps on a website. Once set up, any changes to the spreadsheet will auto-saved by Google and be live on your site when a visitor refreshes the page." This is good.
-
"All it takes to get a website going for a repository on GitHub is a branch named gh-pages containing web files. You also don’t need a master branch, you can have a repo with just one branch named gh-pages. Here is what I think is really cool, if you fork a project with just a gh-pages branch, you’re only a commit away from having a live version yourself. If this repo being forked is using sheetsee.js then everyone is a fork, commit and spreadsheet away from having a live website connected to an easy (a familiar spreadsheet UI and no ‘publish’ flow because Google autosaves) to use database that they manage (control permissions, review revision history)." Very smart.
-
Hosted statistics tool with attractive interface and smart API. Not cheap for its single-tier plan ($99/mo), but looks like it might be worth a poke.
-
"Marky Markov is an experiment in Markov Chain generation implemented in Ruby. It can be used both from the command-line and as a library within your code." It's very fast, and basically does all the work I've been doing on my projects by hand for me. But better.
-
"…nothing really gets older online; the only aging of things here comes from the erosive force of changing human sensibilities. The black of that North Face jacket looks just as black, but the point of wearing it has faded a little. Here there is only the appearance of getting older because everything else has gotten much newer. The pixels do not outwardly become worn. They are like grains of sand. If one is destroyed, it’s too small for us to know it’s been annihilated. And there is so much sand."
-
"I wonder if there’s a business to be gotten into where one shows movies the way everyone wants to see them: just the movies, from the very first second you start watching. It’s a naive thought; I understand that. But I can’t forget that when those lights went down, when that screen went up, and when that twangy riff kicked in, there were audible gasps and cheers in the audience, and someone behind me yelled out “whoa, awesome!” I want to believe that there’s a business to be gotten into that capitalizes on “whoa, awesome”."
-
Stewart Lee's dark, self-referential Christmas tale from this year, for the New Statesman.
-
"In other words, the more packages you send at once, the shittier job FedEx does of delivering each of them, with each package getting less and less of a delivery attempt. And the limit actually approaches zero, which means that if you somehow send me infinity packages through FedEx, they will not even knock on my door. They will take the infinity dollars and run. I did honestly not intend today to use math to prove precisely how bad FedEx is at delivering packages, but, um, here we are?" I love Ryan North.
-
Scraping Canabalt scores off Twitter, ramming them into Mongo and processing in R. The results are not vastly revelatory, but it's a nice account of the process of storing, processing, and representing big data.
-
"…don’t confuse this kind of data exploration, where the goal is to size up the data, with building proper data plumbing, where you want robustness and maintainability. Perl and bash scripts are nice for the former, but can be a nightmare for building data pipelines." Lots of good stuff in this article; this was a highlight.
-
"It’s important to note that this number does not reflect either the number of people owning a mobile phone and that the United Nations Millennium Declaration remains a crucial milestone to reach for the mobile industry. However it shows that homes, bridges, cars, laptops and netbooks, white goods, plants, spimes, and other objects have a mobile phone subscription and are likely to become the most important target segment for mobile operators around the world." Which begs the question: how do you market to things?
-
It Just Works and is good.
-
Learning datamining, using the WoW Armory as a data set.
-
"This page documents the web API calls that allow you to retrieve information from the item system in Team Fortress 2." Steam now has a Web API. Ooooooooh.
-
"Instead of aiming to elevate the medium by making games that are more socially responsible – which by my estimation reduces quickly down to a feature driven approach that ultimately offers little more than cheap didactic moralizing, our aim should be instead to empower our creative visionaries to explore the human condition through their work." In a nutshell: rather than explicitly trying to make 'worthy' games, why not just let people make games about, you know, the human condition – ie, what every other artform does – than just about shooting dudes? (Disclaimer: sometimes, shooting dudes is fun. But I like Clint.)
-
Very simple; very effective.
-
"Golden Hook is an innovative fashion brand which allows you to create made-to-order beanies by choosing your beanie style, material, and color. You also choose the authentic grandmother who will knit your beanie from our gallery of grandma photos." Awesome.
-
Some of these are very nice; many are likely to end up on posters for dubstep nights in Shoreditch soon, I fear.
-
"Need a little excitement? Snap into a little Flickr game I just discovered called Noticings!" Noticings is on the internet telly.
-
"Over the weekend, I wrote a web application that takes advantage of the new [EchoNest] APIs to make it easy to get a click plot for just about any track. Just type in the name of the artist and track and you’ll get the click plot – you don’t have to find the audio or upload it or wrestle with python or gnuplot." Echonest is bloody magic.
Eurogamer in 2009: Score Analysis
18 January 2010
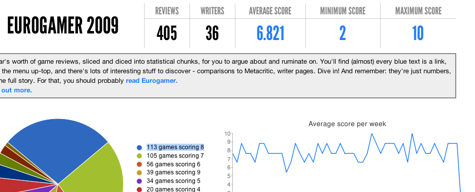
I really liked last.fm’s end-of-year charts. I also really liked this analysis of Pitchfork’s scoring in 2009, just for the statistical fun. And then I thought about my favourite score-oriented website, and wondered why no-one’s done this for Eurogamer yet. I’d be the first to argue that scores in reviews aren’t that important – but everybody loves arguing about them in comments threads, and besides, they make for interesting statistics. What I’d really like would be something like the Pitchfork analysis, but looking a bit more like the last.fm site.
And then after two days I just decided to build it myself.
It’s relatively straightforward: a small app to explore a year’s worth of review scores, built around the pillars of reviews, writers, and scores. Most blue things are clickable; writers have pages that show their reviews, as well as their own averages, deviance from EG’s norm, and the scale of their contribution to the overall average. That latter figure is something I call influence; it took a long while to get to, and I write about it more here. Here’s Simon Parkin’s page as a good example of a writer’s page.
Reviews also have pages – here’s one for Modern Warfare 2, which show how the review compares to the site’s average, the writer’s average, and also to Metacritic. And, of course, you can see just how many games scored 7 – or any other score – if you want. Basically: have a click around.
I started two weeks ago, and guess I stopped committing in the middle of last week, but towards the endit was just front-end tweaks. It’s not been a big project at all – about an hour or two’s work a day on average, in evenings, and lunch-hours, over about ten days.
It’s not a very advanced project, and touches lots of bases I’m working with a lot right now – data analysis, visualisation, scraping. That said, it’s got some interesting stuff under the hood. I’m using Typekit for the attractive type, and it’s been a pleasure to work with. The graphs are a combination of the Google Charts API and gRaphaël, which I’ve had reasonable results from recently. gRaphaël’s strength are beautiful visualisations, rather than ultra-accurate charting, so the pair of tools are used for their strengths. Finally, it’s all deployed on Heroku, which has been a joy as ever; cloud deployment of databased apps, on dynamic hosting, as simple as pushing to a new git repo. And, for the scale of the Eurogamer tool, totally free.
So there you go. A little exploration of some numbers, which bring some interesting figures to light, and was also fun to build. It only felt right to share it. As the site says, scores aren’t everything – you should read reviews too, folks – but when you’ve got numerical data, it seems a shame not to do anything with it.
-
Hmn. Visualisation of tweets about the word "FIFA" (do the maths there) and all games played of FIFA 10 – so you can see both which teams are doing well, and which countries have good FIFA gamers in them. There's little bits of stats-fluff, but it doesn't go nearly deep enough. It's lovely EA are doing this… but it could be, you know, useful, rather than just shiny? Bungie's statistics crown is still a long way off.
-
"Someone at work recently asked how he should go about studying machine learning on his own. So I’m putting together a little guide." Ooh, useful. Lots of starting points for machine learning in R.
-
"When you look at the dubstep scene you realize quickly that it’s a fairly young genre. Not in terms of its own existence as a named thing, but as a measure of the age of many of its prominent musicians. They’re of the generation that doesn’t know a world before the Nintendo Entertainment System and a lot of the music reflects that… If you had a giant Venn Diagram of dubstep and 8-bit chiptunes, you’d see a large overlap between the two. Why dubstep is particularly prone to this, more than other electronic styles, I don’t know. Maybe it has to do with its relatively lo-fi, home studio feel of the genre? … There’s a hidden, untold history there, but it’d be best told by someone that knows the genre, and its players, better than I do. In the meantime, I’ll continue enjoying it until it’s pillaged and destroyed for all its worth." Mike on the overlap between dubstep and chiptune culture.
-
"All artworks have been created using data from the game "Unreal Tournament". Each image represents about 30 mins of gameplay in which the computers AI plays against itself. There are 20-25 bots playing each game and they play custom maps which I create. Each map has been specially designed so that the AI bots have a rough idea of where to go in order to create the image I want. I log the position (X,Y,Z) of each bot, every second using a modification for the game, I also log the position of a death. I then run my own program written in Processing to create printable postscript files of that match."