-
"Rickshaw is a JavaScript toolkit for creating interactive time series graphs." This looks nice.
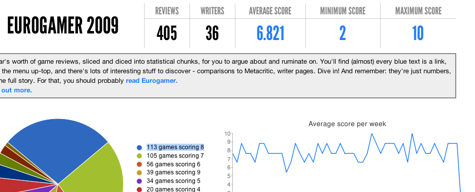
Eurogamer in 2009: Score Analysis
18 January 2010
I really liked last.fm’s end-of-year charts. I also really liked this analysis of Pitchfork’s scoring in 2009, just for the statistical fun. And then I thought about my favourite score-oriented website, and wondered why no-one’s done this for Eurogamer yet. I’d be the first to argue that scores in reviews aren’t that important – but everybody loves arguing about them in comments threads, and besides, they make for interesting statistics. What I’d really like would be something like the Pitchfork analysis, but looking a bit more like the last.fm site.
And then after two days I just decided to build it myself.
It’s relatively straightforward: a small app to explore a year’s worth of review scores, built around the pillars of reviews, writers, and scores. Most blue things are clickable; writers have pages that show their reviews, as well as their own averages, deviance from EG’s norm, and the scale of their contribution to the overall average. That latter figure is something I call influence; it took a long while to get to, and I write about it more here. Here’s Simon Parkin’s page as a good example of a writer’s page.
Reviews also have pages – here’s one for Modern Warfare 2, which show how the review compares to the site’s average, the writer’s average, and also to Metacritic. And, of course, you can see just how many games scored 7 – or any other score – if you want. Basically: have a click around.
I started two weeks ago, and guess I stopped committing in the middle of last week, but towards the endit was just front-end tweaks. It’s not been a big project at all – about an hour or two’s work a day on average, in evenings, and lunch-hours, over about ten days.
It’s not a very advanced project, and touches lots of bases I’m working with a lot right now – data analysis, visualisation, scraping. That said, it’s got some interesting stuff under the hood. I’m using Typekit for the attractive type, and it’s been a pleasure to work with. The graphs are a combination of the Google Charts API and gRaphaël, which I’ve had reasonable results from recently. gRaphaël’s strength are beautiful visualisations, rather than ultra-accurate charting, so the pair of tools are used for their strengths. Finally, it’s all deployed on Heroku, which has been a joy as ever; cloud deployment of databased apps, on dynamic hosting, as simple as pushing to a new git repo. And, for the scale of the Eurogamer tool, totally free.
So there you go. A little exploration of some numbers, which bring some interesting figures to light, and was also fun to build. It only felt right to share it. As the site says, scores aren’t everything – you should read reviews too, folks – but when you’ve got numerical data, it seems a shame not to do anything with it.
-
"Locative social media is especially interesting because it directly affects how people move through the city. It can be terrifically fun and useful for people who fit its prescribed social model." This kind of proscription (or encouragement) of behaviour is interesting, and I think there are a variety of ways to do it "sensibly". And: how did you expand the group of "people who fit its prescribed social model"? Small changes of behaviour, amongst larger groups, are much, much more interesting.
-
"Apple is creating an ecosystem of the kind of customers I don’t want. With the ridiculous approval process leaving bugfixes to take over a week to show up, with prices being driven down to nothing by farting apps… it just feels hostile to me. While I have plenty of great customers who have been raving about the app, all it takes is one little issue and it all comes crashing down." Sad, really.
-
It's the hip-hop-songs-as-charts meme, but about being a PC gamer. Moderate chuckles abound.
-
'London police are now deleting tourists' photos because "photographing anything to do with transport is strictly forbidden."' Oh god.
-
"Protovis is a visualization toolkit for JavaScript using the canvas element. It takes a graphical approach to data visualization, composing custom views of data with simple graphical primitives like bars and dots."
-
"[within the games industry]… the creativity-medium-invention and attitude-practice-deconstruction models often hold no water. Rather, there is only importance placed upon the “talent-meiter-immitation” model that is still in practice in the industry today." An interesting analysis of the nature of education (as it relates to the games industry) and models of learning. I have often lamented the depressing state of how career progression in the industry works, and this article helps quantifies it.
-
A thoughful post (as ever) from the L4D team detailing some of the balancing and planning that's gone into the Survival Mode experience. Looking forward to firing this up next week…
-
"The genre of the palindrome, playful and ludic as it is, nonetheless has a strong implication of violence. In the work of its foremost practitioners, Velemir Khlebnikov and Vladimir Nabokov, as well as some of their postmodern successors, the palindrome is closely linked to death, cannibalism, beheading, and murder."
-
Tom Francis posits an alternate ending to Bioshock, that makes sense of the Vita-Chambers switcheroo, gives the player the agency they've craved, fixes some of the issues with the original ending, and asks you kindly to DROP THE GODDAMN RADIO.
-
"This jQuery plugin generates sparklines (small inline charts) directly in the browser using data supplied either inline in the HTML, or via javascript." Nifty.
-
"…when we step into the shoes of that avatar, be it 1st-person, 3rd-person or otherwise, we exit the darkened movie theater paradigm and enter an intricate, performative, exploratory lab of untested ideas and speculation. We enter a playful space that feels and responds much more like a live theater rehearsal than an interactive movie or a triggered series of movie clips." Michael debunks the games-as-cinema analogy with an interesting take that considers them as more like theatre rehearsal.
-
"This is not a book about the VCS, nor breakout, nor video games and video game culture; it is a chronicle of the experience of that entity we might call “the player.” Oddly, there is little I can take from it in terms of approaches to video gaming or thoughts on the VCS Breakout. But it did enlarge my perspective and help me think about physiological, cognitive, and, let us say, monomaniacal aspects of video game play. Nervous, very dreadfully nervous Sudnow has been, but why would I say that he is mad?" Sudnow passed away very recently; I really ought to read his book, more than ever.
-
"[s3fm]… lets anyone run a streaming radio station, with just a folder of MP3s. Put those MP3s in an Amazon S3 bucket, and give your friends the S3 FM link."
-
Matt's talk (in English) from Lift 09, on scientific fiction, stories, and the design process. Good stuff – not too long – and wonderfully filmed: the cameraman focuses on his hands as much as his face, which is just perfect.
-
NeoGAF users band together to make a perfect, eight-stage, LittleBigPlanet rendition of Contra. Remarkable, especially the behind-the-backdrop puppeteering that makes the walking-into-the-screen levels possible. This had better not get a takedown slapped on it, because it's phenomenal.
-
"Perfect gift for any World of Warcraft player or other MMORPGer in general. You get one "main" glass and one "alt" glass. Serving idea: fill your main with your alcoholic beverage and your alt with your chaser since mains are typically stronger than alts." Oh dear. (But: good gag, and dangerous for drinking games).
-
"SFZero is a Collaborative Production Game. Players build characters by completing tasks for their groups and increasing their Score. The goals of play include meeting new people, exploring the city, and participating in non-consumer leisure activities."
-
"One of my enduring passions is exploring graphic design with programmatic and generative systems. While some aspects of design require the skilled hand of the designer, others can be formalized and explored by computer. For those tasks, Mathematica is an exceptional tool." Some lovely thinking around generative design.
-
"Far Cry 2 is about you and death. Of course every single person you meet wants to kill you. Of course you spend about as much time fighting the environment as other persons. Of course you are clinging to the barest scrap of health and well-being; Even the malaria is trying to kill you."
-
"I spent 10 weeks last Summer as an intern on the strategy team of Transport for London's (TfL) London Rail division…. My general task was to help London Rail start to make use of the oceans of data spewing out of the Oyster smartcard ticketing system, but I spent the bulk of my time working on a project that came to be titled Oyster-Based Performance Metrics for the London Overground. I've posted my final report and slides and outline for the presentation I gave to TfL executive management." Some interesting data and information here.
-
BioWare now have a blog. It looks like it's going to be full of good stuff about games and, especially, writing for them. Can't wait.
-
"The international conference “Thinking After Dark: Welcome to the World of Horror Video Games” unites scholars who all study a corpus that has been left out up to now: horror video games. Considering the relatively slow progress of generic studies among the recent surge of academic interest towards video games, this event represents a major first step."
-
Science doctoral candidates attempt to communicate their thesis subjects through the medium of dance. The winners get time with a professional choreographer to make the whole thing better, and to see it performed by professional dancers at the end. Crazy, wonderful.